In my previous article I shared my approach for processing apache web server log files using PySpark. Here I will try to accomplish the same task using Apache Flink. I am using Apache Flink python (PyFlink) package and Flink SQL. Flink SQL is an ANSI standard compliant SQL engine that can process data both using streaming or batch runtime.
Steps to process web server log files
- install python package (pip install apache-flink)
- create an instance of
- EnvironmentSettings
- TableEnvironment
- create a table source (ingest log files using CsvTableSource method)
- register source as SQL table
- prepare SQL query to create output and run SQL query
- save output as Pandas dataframe
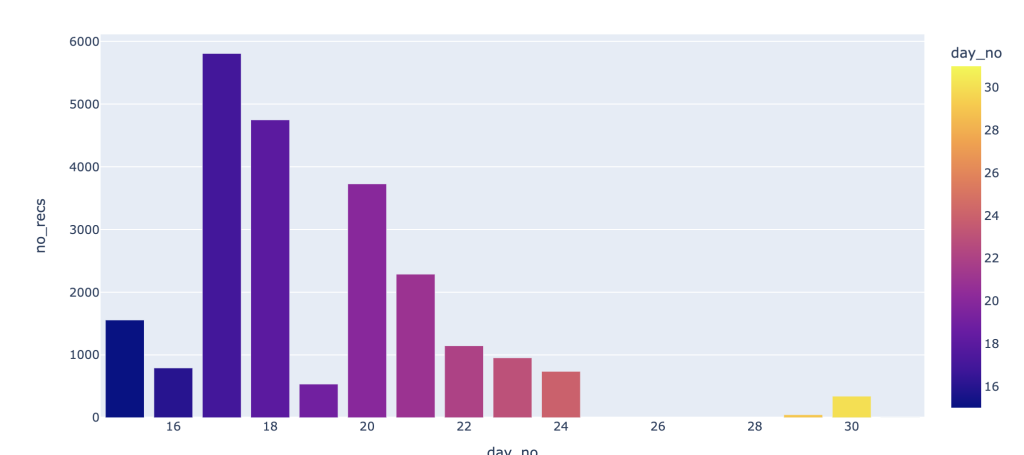
- use plotly.express to display result as a bar chart
I need to find out frequency of ‘/xmlrpc.php’ call by day
# install apache pyflink
!pip install apache-flink

# import pyflink methods
from pyflink.common import Row
from pyflink.table import (EnvironmentSettings, TableEnvironment, DataTypes, FormatDescriptor, CsvTableSource)

# ingest data and display result as bar chart
env_settings = (EnvironmentSettings.new_instance()
                        .in_batch_mode()
                        .build()
    )
tbl_env = TableEnvironment.create(env_settings)

in_field_names = ['ipaddress',
                      'c1',
                      'c2',
                      'datetime',
                      'c3',
                      'method',
                      'endpoint',
                      'protocol',
                      'responsecode',
                      'contentsize',
                      'referer',
                      'useragent']
in_field_types = ([DataTypes.STRING(),
                       DataTypes.STRING(),
                       DataTypes.STRING(),
                       DataTypes.STRING(),
                       DataTypes.STRING(),
                       DataTypes.STRING(),
                       DataTypes.STRING(),
                       DataTypes.STRING(),
                       DataTypes.STRING(),
                       DataTypes.STRING(),
                       DataTypes.STRING(),
                       DataTypes.STRING()]
    )
field_delim = ' '
source = CsvTableSource(
        '/content/var/log/apache2/',
        in_field_names,
        in_field_types,
        field_delim,
        lenient=True,
        ignore_first_line=False
)
tbl_env.register_table_source('apachelog', source)
# prepare SQL statment and execute
query = """
select ipaddress,datetime,endpoint,protocol,responsecode
from apachelog
"""
output = tbl_env.sql_query(query)
# Convert the PyFlink Table to a Pandas DataFrame
df = output.to_pandas()
# create BAR chart
import plotly.express as px
px.bar(
  df,
  x="day_no",
  color="day_no",
  y="no_recs",
  barmode='group'
)
Output