Key Summary for Technical Leadership
For the CTO: Strategic Value & ROI
- Zero Hallucinations Protocol: By decoupling “Learning” (Ingestion) from “Thinking” (Runtime), we eliminate the primary risk of GenAI in analytics. The Agent cannot query columns that do not exist in the Vector Index.
- Cost Efficiency: Heavy schema processing happens once (Build Time), not on every query. The Runtime Agent is lightweight, reducing token costs by ~40% compared to full-schema injection.
- Security First: The system never executes SQL directly. It generates JSON for a Semantic Layer (Cube.js), ensuring that all Row-Level Security (RLS) and Access Policies are enforced by the BI engine, not the AI.
For Senior Data Engineers: Maintainability & Scale
- No “Prompt Engineering” for Schema Changes: You do not need to rewrite prompts when the schema changes. Simply run the sync script to update the Vector Index automatically.
- Debuggability: The audit tools allow you to inspect exactly what the Agent “knows” about a specific term (e.g., “New York”). If the Agent fails, you can trace it to a missing vector record rather than a vague model behavior.
- Clean Separation of Concerns: Data Prep happens in SQL (
LlmContext.js), Logic in Python (golden_dataset.yaml), and Runtime in the Strands SDK (getreflect_ask_aws.py). This allows teams to iterate on data quality without breaking the Agent’s reasoning logic.
2. Executive Summary
Traditional Text-to-SQL approaches are fundamentally flawed for enterprise analytics. They rely on “probabilistic guessing”—hoping a Large Language Model (LLM) can hallucinate valid SQL joins and complex aggregations from a raw database schema. This results in brittle systems that break with every schema change and fail to capture business context.
The Federated Semantic Agentic AI introduces a paradigm shift: Text-to-Cube.js JSON. Instead of generating raw SQL, the Agent constructs structured, validated JSON queries against a Semantic Layer (Cube.js). This architecture utilizes a Decoupled Strategy, separating Knowledge Ingestion (Build Time) from Reasoning & Inference (Run Time), orchestrated by the Strands SDK.
3. Solving the “Four Horsemen” of LLM Analytics
Enterprise GenAI applications typically fail due to four specific challenges. The Federated Semantic Agentic AI addresses each through architectural engineering rather than prompt engineering alone.
Challenge 1: Context Bloat
- The Problem: Stuffing an entire database schema (thousands of columns) into an LLM’s context window leads to the “Lost in the Middle” phenomenon, increasing latency and cost while degrading reasoning.
- The Solution: Just-in-Time Retrieval (RAG). The system indexes the semantic layer into a Vector Store (LanceDB). At runtime, the Agent retrieves only the specific measures and dimensions relevant to the user’s intent.
- Implementation: The
search_knowledge_basetool restricts output to the top-k most relevant semantic members, keeping the context window lightweight.
- Implementation: The
Challenge 2: Schema Overload
- The Problem: Raw database schemas are messy, cryptic, and often contain thousands of irrelevant tables. LLMs struggle to distinguish between
users.created_at(metadata) andusers.joined_at(business logic). - The Solution: Decoupled Ingestion Pipeline. The Agent never connects to the raw database. It connects to a curated Semantic Index. The ingestion script (
sync_to_vector_db.py) filters and cleans metadata before the Agent ever sees it.- Implementation: The Ingestor streams only defined Measures and Dimensions from the Semantic Layer, effectively compressing infinite schema complexity into a curated search index.
Challenge 3: Semantic Accuracy (Hallucinations)
- The Problem: LLMs confidently invent columns (e.g.,
Users.location) that don’t exist, causing SQL errors. - The Solution: Tri-Factor Grounding & Validation.
- Explicit Mapping: Metadata includes
target_membertags (e.g., “Maps to:Users.city“) to force precise column selection. - Dry-Run Validation: The
@tool validate_query_columnsruns a zero-latency validation against the Cube API to detect400 Bad Requesterrors before responding to the user.
- Explicit Mapping: Metadata includes
Challenge 4: Ambiguity
- The Problem: Users use vague terms like “Cash” (Revenue? Profit?) or “Paris” (City? Brand?).
- The Solution: Stratified Context & Federated Protocol.
- Entity Resolution: The
LlmContextcube uses stratified sampling to index high-cardinality values, ensuring the Agent knows “Nike” is aBrandand “Paris” is aCity. - Federated Protocol: The system prompt enforces a strict separation of “Target” (Measures) vs. “Context” (Filters), reducing ambiguity in intent parsing.
- Entity Resolution: The
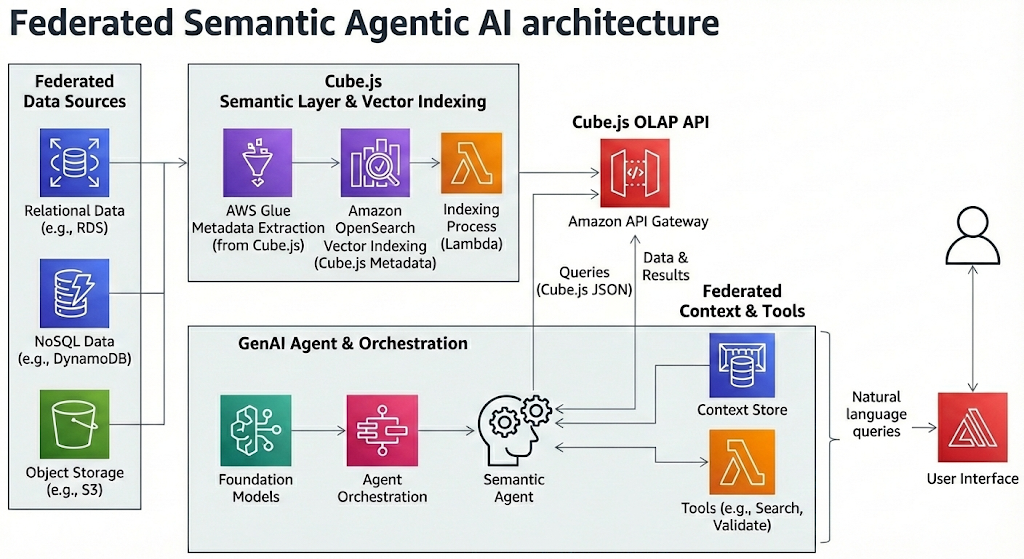
4. Architectural Blueprint
The system operates in two distinct phases to ensure zero-hallucination responses.
Phase A: Build Time (The “Learner”)
A batch ETL process runs on a schedule. Its job is to “read” the Semantic Layer definitions and build a highly optimized Vector Index (LanceDB).
- Ingestion Stream 1 (Semantic Schema): Ingests Measures (e.g.,
Orders.revenue) and Dimensions (e.g.,Users.city) as defined in the Cube.js schema. - Ingestion Stream 2 (Business Logic): Ingests the Golden Dataset—verified Q&A pairs that teach the agent complex filtering logic (e.g., “Whales” =
count > 1000). - Ingestion Stream 3 (Data Values): Ingests stratified samples of high-cardinality data to enable precise entity resolution.
Phase B: Run Time (The “Agent”)
A lightweight Agent handles user queries. It connects to the pre-built Vector Store and uses the Strands SDK to reason, plan, and validate.
- The ReAct Loop:
- Thought: Analyzes user intent.
- Tool Action: Queries Vector DB (
@tool search_knowledge_base). - Observation: Receives grounded schema data (e.g., “Maps to
Users.city“). - Drafting: Constructs a Cube.js JSON object.
- Validation: Dry-runs JSON against the Cube API (
@tool validate_query_columns). - Final Answer: Returns validated JSON.
5. Technical Implementation Details
A. Strands SDK & Tool Decorators
We leverage Strands Tool Decorators (@tool) to define strongly-typed capabilities. This creates a clear interface for the Foundation Model.
Python
@tool
def search_knowledge_base(query: str) -> str:
    """
    Search the Knowledge Base for Schema Members (Measures/Dimensions),
    Business Logic Rules, or Data Values.
    """
    return self.kb.search(query)

@tool
def validate_query_columns(json_str: str) -> str:
    """
    Validate a Cube.js JSON query structure against the API.
    Use this to check for 400 Errors before giving a Final Answer.
    """
    return self.validator.validate(json_str)
B. Stratified Context (LlmContext)
To solve entity resolution, we do not index all data. We use Stratified Sampling within the Semantic Layer to ensure representation.
- SQL Logic:
ROW_NUMBER() OVER (PARTITION BY category ORDER BY popularity DESC)ensures we capture the “Head” terms (e.g., “Nike”) while maintaining representation for “Tail” categories. - Explicit Mapping: The metadata includes a
target_memberfield. When the Agent finds “New York”, it seestarget_member: Users.city, preventing it from guessing generic columns.
C. Multi-Tenant Security
The architecture supports SaaS deployments via a Context Manager pattern.
- Context Propagation: A
context.pymodule (runtime injection) stores the request-scopedtenant_id. - Scoped JWTs: The
CubeValidatorgenerates short-lived, signed JWTs inside the tool execution. This injects the security context (u: {tenant_id: ...}) dynamically, ensuring the dry-run validation respects Row-Level Security (RLS).
6. AWS Generative AI Competency Mapping
This architecture directly implements the domains and skills outlined in the AWS Certified Generative AI Developer Professional standards.
| AWS Domain | Skill / Competency | Implementation Detail |
| Data Management | Skill 1.4.1: Create advanced vector database architectures. | Implementation of LanceDB with stratified indexing in sync_to_vector_db.py. |
| Implementation | Skill 2.1.1: Develop intelligent autonomous systems (Agentic AI). | The ReActAgent class uses the Strands SDK (strands.Agent) for reasoning loops. |
| Implementation | Skill 2.1.6: Implement intelligent tool integrations. | Utilization of @tool decorators to expose Python functions to the FM. |
| Security | Skill 3.1.3: Develop accuracy verification systems. | The CubeValidator tool acts as a grounding mechanism to prevent hallucinations. |
| Optimization | Skill 4.1.2: Create cost-effective model selection. | Decoupled Architecture shifts heavy processing to “Build Time,” enabling faster/cheaper models at “Run Time.” |